Last 12 months
Price
$1,860,000median
$1,595,000 – $2,125,000 · 2 sales
Residential Development · VIETNAM
No homes listed here right now · 220 m from Ben Thanh Central Metro
De Centurion is a benchmark residential development in VIETNAM, compiled from official open data and property registry records.
Written from official data: the development registry, LTA, MOE, NEA and NParks. Sale prices, rents and tenure are below, from URA.
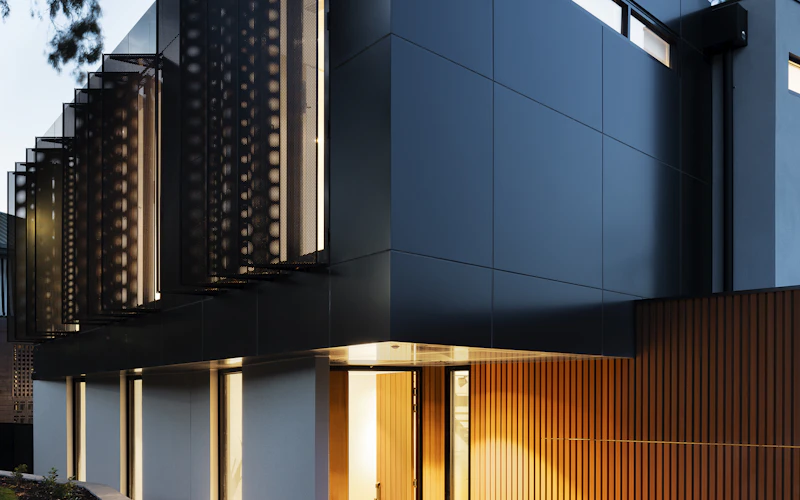
De Centurion · VIETNAM — Architectural Exterior & Tower Facade
Try homes nearby instead.
Homes for sale in VIETNAM Homes near Ben Thanh Central MetroWhat buyers paid for homes here, from URA’s records of private home sales. Not a valuation.
Last 12 months
$1,860,000median
$1,595,000 – $2,125,000 · 2 sales
Last 12 months
$2,047median psf
Oct 2025 – Sep 2026
Tenure
No lease end
| Month | Floor | Size | Sale | Price |
|---|---|---|---|---|
| Sep 2026 | 01-05Resale | 775 sq ft | Resale | $1,595,000$2,058 psf775 sq ft |
| Feb 2026 | 01-05Resale | 1,044 sq ft | Resale | $2,125,000$2,035 psf1,044 sq ft |
| Jun 2024 | 06-10Resale | 570 sq ft | Resale | $980,000$1,718 psf570 sq ft |
| May 2024 | 11-15Resale | 775 sq ft | Resale | $1,500,000$1,935 psf775 sq ft |
| Dec 2022 | 06-10Resale | 775 sq ft | Resale | $1,420,000$1,832 psf775 sq ft |
| Apr 2022 | 11-15Resale | 1,044 sq ft | Resale | $1,925,000$1,844 psf1,044 sq ft |
| Dec 2021 | 06-10Resale | 1,044 sq ft | Resale | $1,760,000$1,686 psf1,044 sq ft |
Dec 2021 – Sep 2026, by the month the sale was agreed; 7 sales in all. Homes differ in floor, size, facing and condition; purchases of several units at once are left out. Source: URA (Urban Redevelopment Authority), private residential transactions.
What tenants agreed to pay for whole homes here, from URA’s records of rental contracts. Not a valuation.
Last 12 months
$3,100median a month
$3,000 – $3,550 · 5 rentals
Last 12 months
$4,600median a month
$4,500 – $4,700 · 2 rentals
| Month | Bedrooms | Size | Rent |
|---|---|---|---|
| Aug 2026 | 1500–600 sq ft | 500–600 sq ft | $3,550a month |
| Jul 2026 | 31,000–1,100 sq ft | 1,000–1,100 sq ft | $4,700a month |
| Mar 2026 | 1500–600 sq ft | 500–600 sq ft | $3,100a month |
| Jan 2026 | 1500–600 sq ft | 500–600 sq ft | $3,550a month |
| Nov 2025 | 1500–600 sq ft | 500–600 sq ft | $3,000a month |
| Nov 2025 | 31,000–1,100 sq ft | 1,000–1,100 sq ft | $4,500a month |
| Oct 2025 | 1500–600 sq ft | 500–600 sq ft | $3,000a month |
| Aug 2025 | 31,000–1,100 sq ft | 1,000–1,100 sq ft | $4,700a month |
| Jul 2025 | 2700–800 sq ft | 700–800 sq ft | $4,000a month |
| May 2025 | 31,000–1,100 sq ft | 1,000–1,100 sq ft | $4,600a month |
Oct 2024 – Aug 2026, by the month the lease started; 21 rentals in all. Sizes are URA’s bands. Homes differ in floor, size, furnishing and condition. Source: URA (Urban Redevelopment Authority), private residential rental contracts.
Straight-line distances from the station reference point, not walking distance. Mapping snapshot: 2026-10-15. Location data: OneMap / Singapore Land Authority.
Based on official URA resale & rental records, estimated gross rental yield is ~3.2%–3.5%. Calculate Stamp Duty or explore nearby buildings: